最近做可视化数据要用到折线图表来展示数据,Flutter 中的图表库有 charts_flutter、fl_chart 等,从易用性上最终决定了使用 fl_chart ,本文以国家统计局房价指数为数据来源,来实现一个 fl_chart 图表的小项目。
添加依赖
fl_chart 目前最新版本是 0.68,这里没有使用最新的版本是因为本地电脑的 dart 版本是 2.19.1,而最新版本 0.68 要求 dart 的最低版本是 3.2,考虑到需要兼容之前的项目,暂未升到最新版本。
数据来源
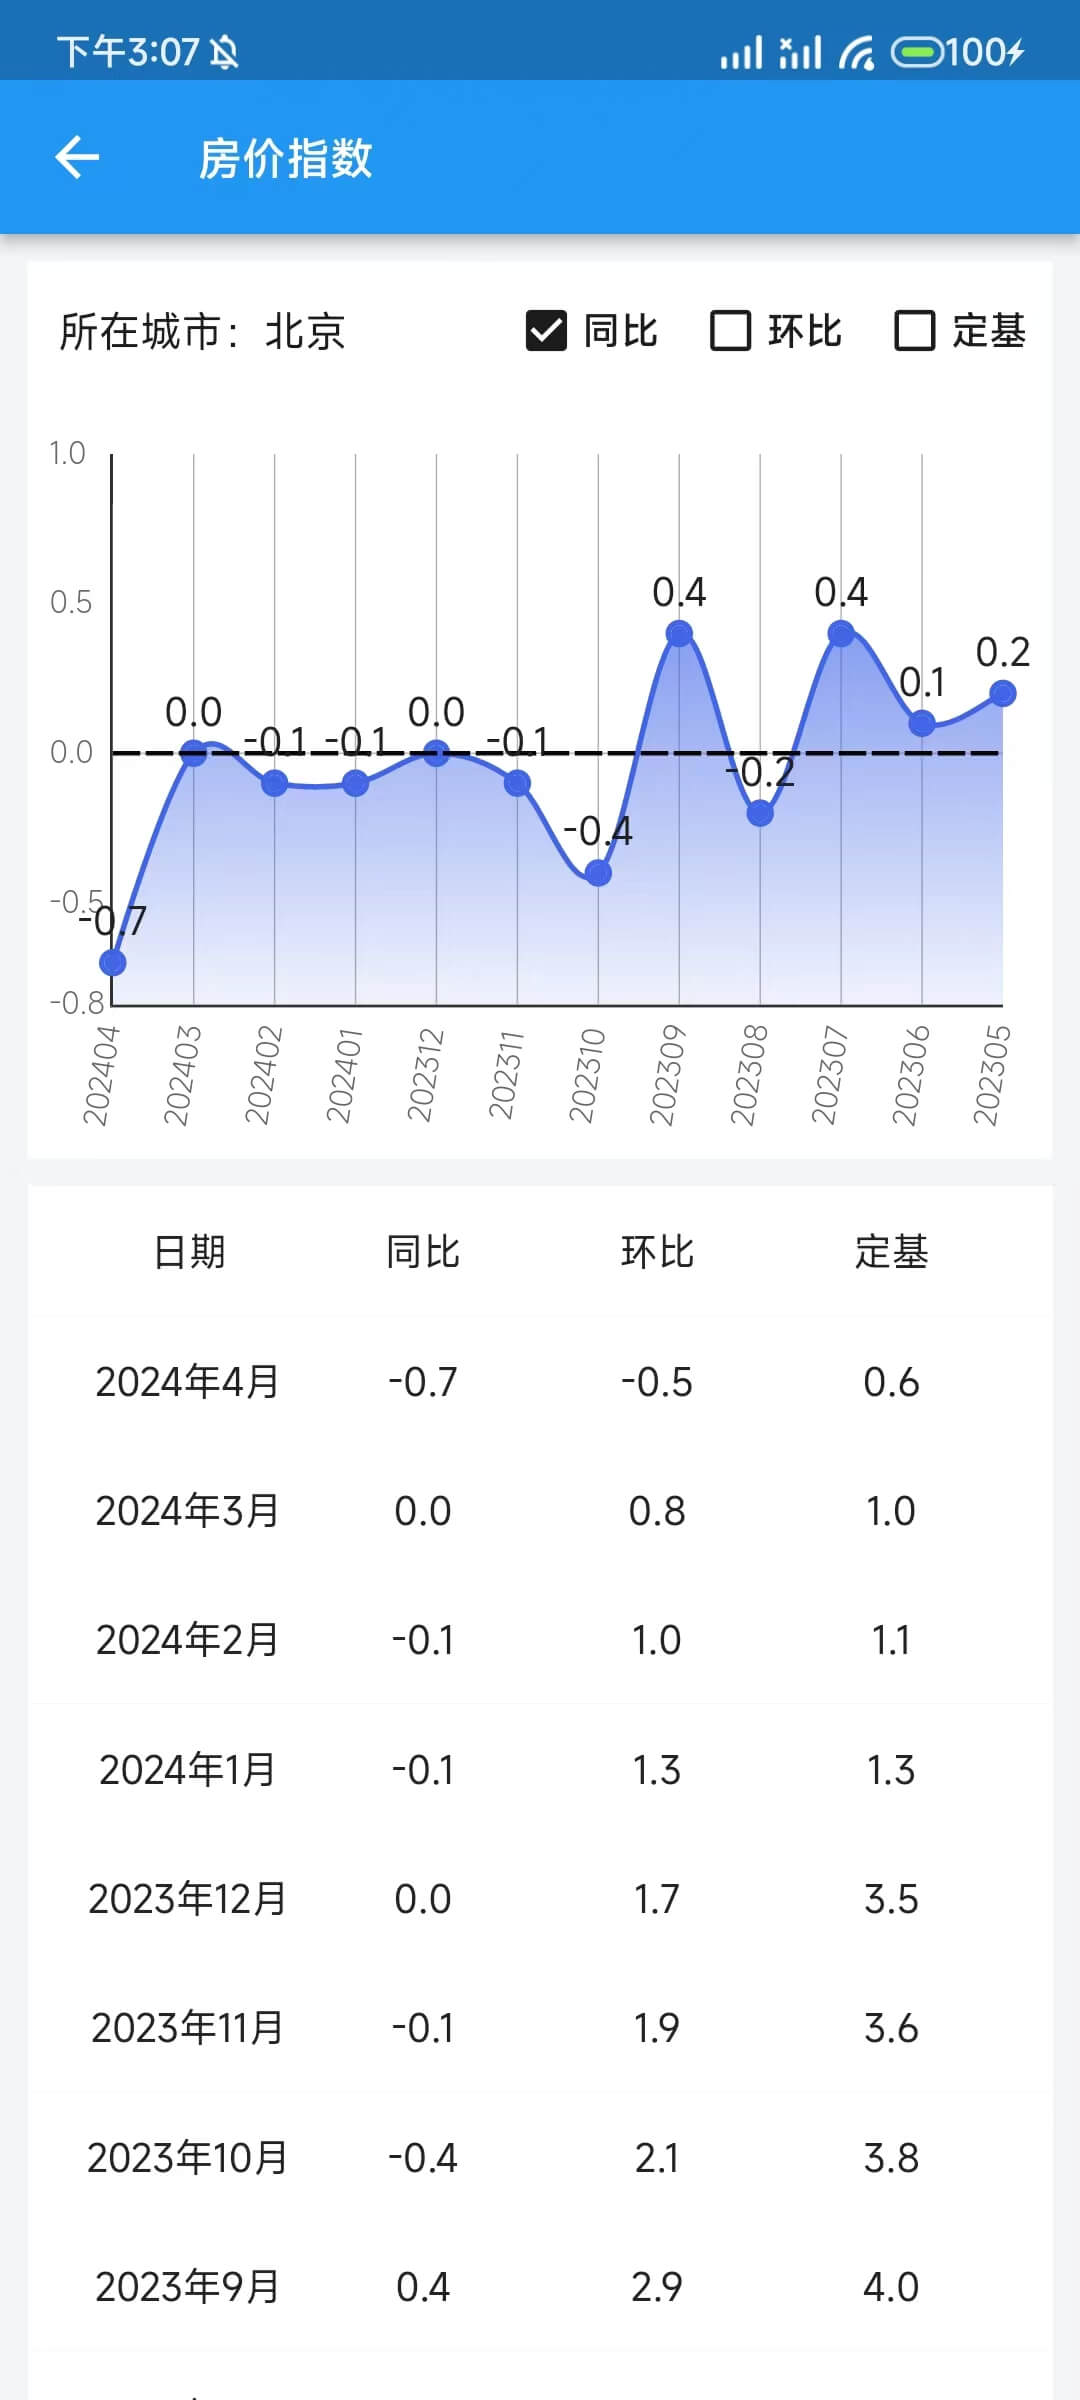
本文用到的数据是来自国家统计局公布的房价指数,这些数据在国家统计局官网上也能查看到,但可视化查看起来不是很方便,本文使用到的数据也只是其中一部分(如下图中的数据),目的是用来学习和研究,并没有用于其它任何商业用途。

LineChart
创建类 LineChartWidget ,在这里添加 LineChart 类。LineChartWidget 有三个属性,listItems 是要展示的数据,selectedCity 表示当前选中的城市,dates 是需要展示数据的月份数组,selectIndexType 当前展示的数据的类型,数据的类型有:同比指数、环比指数和定基指数。
1
2
3
4
5
6
7
8
9
10
11
12
13
14
15
16
17
18
19
20
21
22
| @immutable
class LineChartWidget extends StatelessWidget {
final List<ListItem> listItems;
final CityModel? selectedCity;
final List<String> dates;
final IndexType selectIndexType;
const LineChartWidget(
{Key? key,
required this.listItems,
required this.selectedCity,
required this.dates,
required this.selectIndexType})
: super(key: key);
@override
Widget build(BuildContext context) {
return LineChart(
mainData(),
);
}
}
|
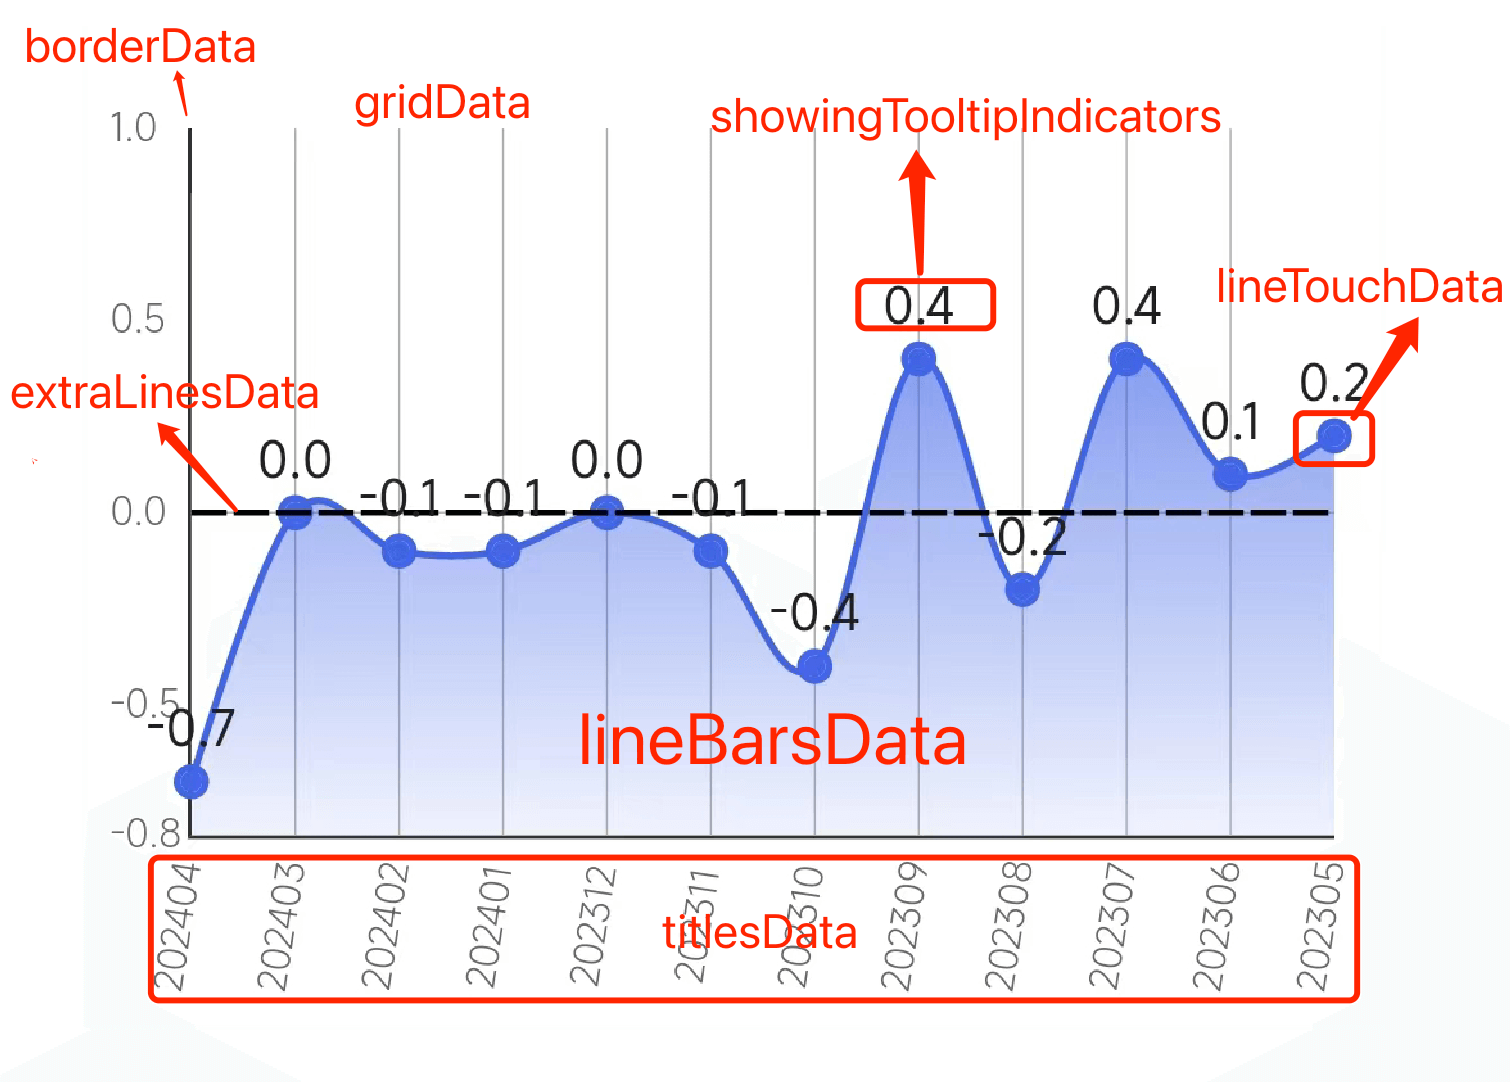
LineChart 需要一个 LineChartData 参数,重点也就是这个 LineChartData,大部分关于线形图的参数设置在这个类里,第一次使用 fl_chart 看到这些参数也有点看不懂,下面介绍一下常用的几个参数。
1
2
3
4
5
6
7
8
9
10
11
12
13
14
15
16
17
18
19
20
21
22
23
24
25
26
27
28
29
30
31
32
33
34
35
36
37
38
39
40
41
42
43
44
| LineChartData(
maxX: dates.length - 1,
minX: 0,
baselineY: 0.0,
minY: numMin,
maxY: numMax.ceilToDouble(),
showingTooltipIndicators: showIndexes.map((index) {
return ShowingTooltipIndicators([
LineBarSpot(lineBarsData[0], lineBarsData.indexOf(lineBarsData[0]),
lineBarsData[0].spots[index]),
]);
}).toList(),
gridData: gridData,
titlesData: titlesData,
lineTouchData: lineTouchData,
borderData: FlBorderData(
show: true,
border: const Border(
left: BorderSide(color: Color(0xff313131)),
bottom: BorderSide(color: Color(0xff313131))),
),
extraLinesData: ExtraLinesData(horizontalLines: [
HorizontalLine(
y: 0.0,
color: const Color(0xff010101),
strokeWidth: 1.6,
dashArray: [10, 2],
),
]),
lineBarsData: lineBarsData,
)
|
对于在图上的各个配置

其中 lineBarsData 就是曲线图的内容了,要求返回一个数组,意思是可以同时显示多条曲线,我们这里只需要一条,点击勾选☑️来切换显示同比指数、环比指数或者定基指数。下面生成一个LineChartBarData 类并添加到数组中。
1
2
3
4
5
6
7
8
9
10
11
12
13
14
15
16
17
18
19
20
21
22
23
24
25
26
27
28
29
30
31
32
33
34
35
36
37
38
39
40
41
42
| LineChartBarData generateLineChartBarData(
{List<double> yValues = const [],
Color color = const Color(0xFF7351F6),
Color dotColor = const Color(0xFF002AFF)}) =>
LineChartBarData(
isCurved: true,
showingIndicators: yValues.asMap().keys.toList(),
spots: yValues.asMap().entries.map((e) {
return FlSpot(e.key.toDouble(), e.value);
}).toList(),
isStrokeJoinRound: true,
color: color,
barWidth: 1.4,
isStrokeCapRound: false,
dotData: FlDotData(
show: true,
getDotPainter: (spot, percent, barData, index) {
return FlDotCirclePainter(
radius: 2,
color: dotColor,
strokeWidth: 1.2,
strokeColor: dotColor,
);
}),
belowBarData: BarAreaData(
show: true,
gradient: LinearGradient(
begin: Alignment.topCenter,
end: Alignment.bottomCenter,
colors: [color.withAlpha(160), color.withAlpha(20)],
),
),
);
|
配置 titlesData,只显示左边和底部的 title。
1
2
3
4
5
6
7
8
9
10
11
12
13
14
15
16
17
18
19
20
21
22
23
24
25
26
27
28
29
30
31
32
33
34
35
36
37
38
39
40
41
42
| FlTitlesData get titlesData => FlTitlesData(
show: true,
rightTitles: AxisTitles(
sideTitles: SideTitles(showTitles: false),
),
topTitles: AxisTitles(
sideTitles: SideTitles(showTitles: false),
),
bottomTitles: AxisTitles(
sideTitles: SideTitles(
reservedSize: 50,
showTitles: true,
interval: 1,
getTitlesWidget: bottomTitleWidgets,
),
),
leftTitles: AxisTitles(
sideTitles: SideTitles(
showTitles: true,
getTitlesWidget: leftTitleWidgets,
),
),
);
Widget bottomTitleWidgets(double value, TitleMeta meta) {
const style = TextStyle(
fontWeight: FontWeight.w300, fontSize: 11, color: Color(0xFF666666));
String date = dates[value.toInt()];
return SideTitleWidget(
axisSide: meta.axisSide,
angle: 30,
space: 14,
child: Text(date, style: style),
);
}
Widget leftTitleWidgets(double value, TitleMeta meta) {
const style = TextStyle(
fontWeight: FontWeight.w300, fontSize: 11, color: Color(0xFF666666));
String text = NumberUtil.getNumByValueDouble(value, 1).toString();
return Text(text, style: style, textAlign: TextAlign.left);
}
|
设置网格线样式 gridData
1
2
3
4
5
6
7
8
9
10
11
12
13
14
15
16
17
18
19
| FlGridData get gridData => FlGridData(
show: true,
drawVerticalLine: true,
drawHorizontalLine: true,
horizontalInterval: 1,
verticalInterval: 1,
getDrawingHorizontalLine: (value) {
return FlLine(
color: const Color(0xffaeaeae),
strokeWidth: 0.5,
);
},
getDrawingVerticalLine: (value) {
return FlLine(
color: const Color(0xffaeaeae),
strokeWidth: 0.5,
);
},
);
|
设置 lineTouchData 触摸行为,也就是点击数据点时的显示效果。
1
2
3
4
5
6
7
8
9
10
11
12
13
14
15
16
17
18
19
20
21
22
23
24
25
26
27
28
29
30
31
32
33
34
35
36
37
38
39
40
| LineTouchData get lineTouchData => LineTouchData(
enabled: false,
getTouchedSpotIndicator:
(LineChartBarData barData, List<int> spotIndexes) {
return spotIndexes.map((index) {
return TouchedSpotIndicatorData(
FlLine(
color: Colors.transparent,
),
FlDotData(
show: false,
),
);
}).toList();
},
touchTooltipData: LineTouchTooltipData(
tooltipBgColor: Colors.transparent,
tooltipRoundedRadius: 9,
tooltipPadding: const EdgeInsets.only(bottom: -10),
getTooltipItems: (List<LineBarSpot> lineBarsSpot) {
return lineBarsSpot.map((lineBarSpot) {
return LineTooltipItem(
lineBarSpot.y.toString(),
const TextStyle(
color: Color(0xFF212121),
fontSize: 14,
fontWeight: FontWeight.normal),
);
}).toList();
},
),
);
|
实现效果
来看看最终的实现效果

小结
上面 LineChart 为例介绍了它使用方法和参数,fl_chart 还有 BarChart、PieChart 等其它可视化图表,使用方法和参数上大同小异吧,用的时候如果还有不知道的可以去看看官方文档。fl_chart 在众多 Flutter 图表框架中使用人数还是比较多的,功能丰富,也能满足不少自定义的需求,但相对于原生 iOS、Android 平台的图表框架,fl_chart 还是有一些不足和局限,如它不支持 x、y 轴的滚动、Tooltip 仅支持基本的文本样式定制,不支持更复杂的布局和内容、对于非常复杂的图表,如多个折线、多层次的图表组合,fl_chart 的性能可能不足以满足需求,渲染时间会明显增加等等,当然这些功能的完善都需要一个过程。
以上的开源代码在这里:源码 供大家参考,本文虽然没有特别复杂的原理和逻辑,但是从调试数据、翻看整理文档、代码实现和细节调整,这样的一个小项目也是花了不少时间和精力,希望能够帮到你,感谢阅读,记得加关注和点赞哦。


